Turn German locations into demographic insights.
Get population and age structure for any location in Germany. Ready to use in your applications and analysis.
Check individual addresses now. Self-service spreadsheet export and list upload coming soon.
An account is required for address lookup.
What an address report looks like.
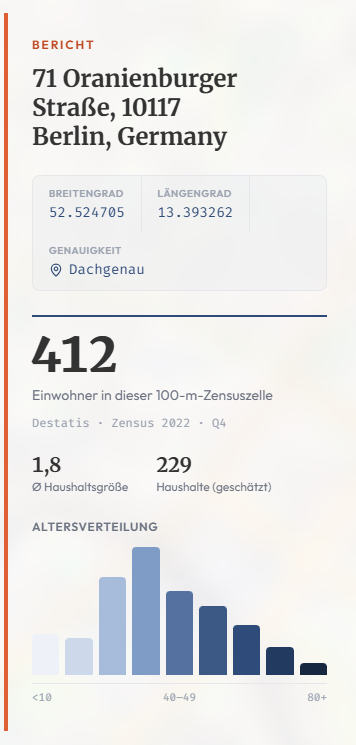
- Example address
- 71 Oranienburger Straße, 10117 Berlin, Germany
- Coordinates
- 52.524705, 13.393262
- Residents
- 412 residents in the associated 100 × 100 m census cell
- Displayed source
- Destatis · Zensus 2022 · Q4
- Households
- Average household size: 1.8; 229 households (estimated)
The report also shows age distribution; individual band values are not provided here.
Rooftop accuracy refers to geocoding, not the spatial precision of demographics.
Match addresses. Analyse the data yourself.
Match addresses to the right data.
rastr matches each address to its corresponding grid cell.
Data for your own analysis.
In the CSV pilot, use the manually prepared file in Excel or Power BI; the analysis remains yours.
Understand data periods.
Census values and modeled updates remain clearly labelled.
How to receive your pilot spreadsheet
Pilot: manually prepared
- Send a request with your use case
- Provide addresses after follow-up
- Receive a manually prepared spreadsheet
- Analyse it yourself in Excel or Power BI
Self-service in preparation
- Enter an address or upload a spreadsheet list
- Receive demographic results as Excel or CSV
In the pilot, we manually prepare the existing per-address results as CSV. Self-service export and list upload are not yet available.
Understand data periods and limitations
Census 2022: baseline data.
Official Census 2022 values for the associated 100 × 100 m grid cell form the baseline. Unpublished or suppressed values remain missing, not zero residents.
Q1 2026: modeled update.
Where available, Q1 2026 modeled updates use official input sources. They are estimates, not official observations of every grid cell in 2026. The data period and available provenance remain distinguished from census values.
The data describes the residential population of the specified grid cell. It does not measure footfall, impressions, or actual screen audiences. Q1 2026 values are modeled estimates.
Spreadsheet pilot project
Free validation pilot: one manually prepared CSV with up to 20 addresses per organisation. Larger or repeated requests require a separate agreement. Self-service export is not yet available.
We collect your addresses during follow-up. Your request does not start an automatic export.
Check individual addresses now. Self-service CSV export and list upload are in preparation. We manually prepare CSV files for initial pilot projects.
By sending your request, you consent to the processing of your email address, intended use and optional organisation details to respond and coordinate the CSV pilot. Submission is delivered through Web3Forms. You are not subscribing to a newsletter. More information: Privacy policy
Frequently asked questions
What data will I receive?
You receive population and age structure from existing address results. Where available, Census 2022 values and modeled Q1 2026 values are labelled separately with their data periods. Missing or suppressed values are not replaced with zero.
What do the population figures refer to?
Figures describe the address-associated 100 × 100 m grid cell, not the individual building, a radius or a measured catchment. Multiple addresses can share a cell; their population counts do not represent independent audiences.
How do Census 2022 and Q1 2026 differ?
Census 2022 supplies the official baseline. Q1 2026 denotes modeled estimates using official inputs, not a new observation of every cell. This does not establish greater accuracy than the census baseline.
Does rastr show a screen's actual audience?
No. rastr describes the residential population of the grid cell. It does not measure footfall, impressions or actual screen audiences. The data complements other planning evidence.
Can I already upload files or download CSVs myself?
Not through self-service yet. Individual address lookup is already available. Pilot CSV files are prepared manually; list upload and automated export are in preparation.
What does the free pilot include?
One free, manually prepared CSV with up to 20 addresses per organisation. Larger or repeated requests require a separate agreement. The pilot tests usefulness in your workflow.
What happens after my request, and which prices apply?
We follow up about your use case and agree on addresses and next steps. There is no instant export or promised deadline. The free pilot is separate from unchanged published pricing. Existing use and data terms continue to apply.
Published pricing